
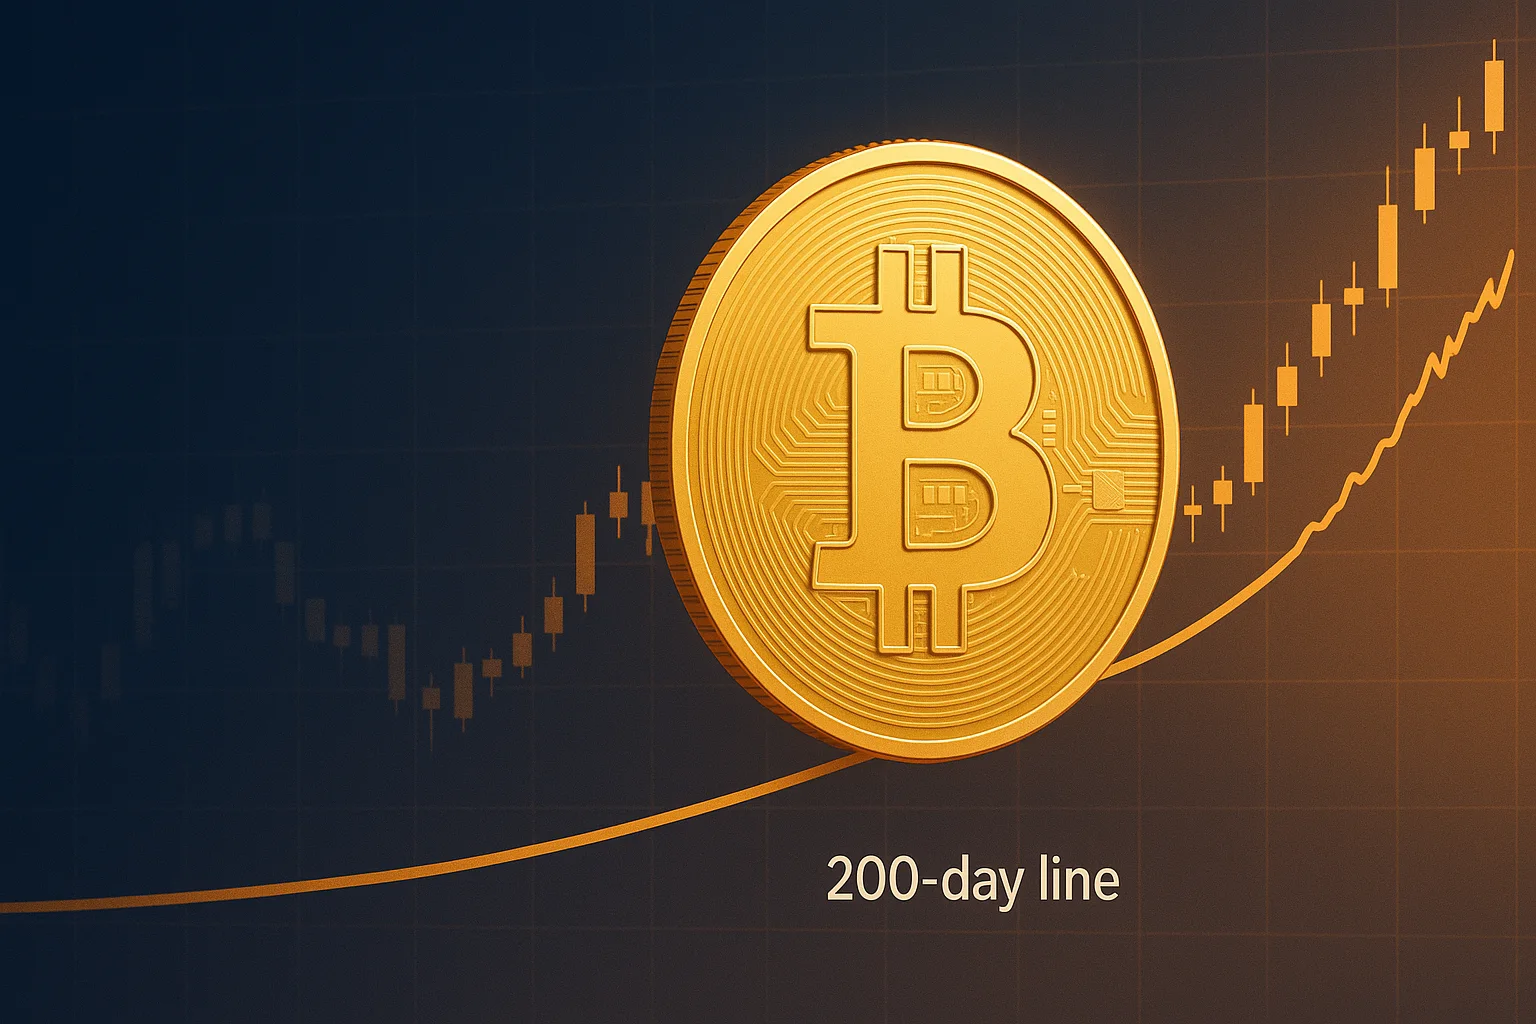
Understanding Bitcoin’s 200-Day Moving Average
Bitcoin, the pioneer of the crypto world, never fails to capture the attention of investors and traders alike. One of the most widely followed indicators in the markets is the 200-day moving average (DMA). But what exactly is the 200 DMA, and why does it matter so much when discussing Bitcoin’s price trajectory?
The 200-day moving average is a technical indicator that smooths out price data by creating an average price that updates daily, incorporating the last 200 days of trading. It’s a key long-term trend indicator used by many traders to assess whether an asset is in a bullish or bearish phase.
Why the 200 DMA is Important for Bitcoin
For traditional markets, the 200 DMA acts as a critical support or resistance level. Bitcoin is no different. When Bitcoin’s price is above the 200 DMA, traders typically consider the asset to be in an uptrend; conversely, dropping below this average suggests potential bearishness.
Historical data shows that Bitcoin’s interactions with the 200 DMA play a significant role in shaping market sentiment. In bull runs, price often finds support near or well above this level, while crashes often occur when Bitcoin fails to hold above it.
Current Market Situation: Where Does Bitcoin Stand?
As of early 2024, Bitcoin’s price has been showing signs of consolidation after a period of volatility. This has led many to question whether the price will soon approach or break through the 200-day moving average.
Checking recent charts, Bitcoin has hovered around key average levels, with traders closely watching for confirmation of trend direction:
- Above 200 DMA: Suggests renewed bullish momentum, possibly indicating accumulation phases and attracting long-term investors.
- Below 200 DMA: Could hint at prolonged market weakness, causing caution among traders.
Market Sentiment and Influencing Factors
The crypto markets are influenced by a mix of factors — macroeconomic conditions, regulatory news, technological upgrades, and market psychology.
- Economic conditions: Inflation rates, Federal Reserve policies, and global economic stability impact investor appetite.
- Regulation: News about crypto regulation can lead to sharp market moves in either direction.
- Technological developments: Upgrades like Bitcoin’s Taproot can instill confidence.
- Institutional interest: Growing participation by institutions often supports upward price momentum.
Technical Indicators Complementing the 200 DMA
While the 200-day moving average is a powerful tool on its own, traders often combine it with other indicators to get a fuller picture of Bitcoin’s potential paths.
- Relative Strength Index (RSI): Helps identify overbought or oversold conditions.
- Moving Average Convergence Divergence (MACD): Measures momentum and trend changes.
- Volume analysis: Sharp moves supported by volume often validate trends.
Currently, these indicators show mixed signals, which may point toward short-term uncertainty but potential longer-term stabilization near the 200 DMA.
Expert Opinions: Will Bitcoin Break or Hold the 200 DMA?
Industry experts and analysts provide varied views on Bitcoin’s near future:
- Optimistic perspective: Some believe that Bitcoin is setting the stage for a next bullish wave, especially if it can firmly stay above the 200-day average. They cite strong on-chain metrics and increasing institutional interest as reasons for confidence.
- Bearish caution: Others warn that if macroeconomic headwinds persist or if Bitcoin fails to break above the 200 DMA convincingly, it could enter a protracted consolidation or correction phase.
What This Means for Crypto Investors
For anyone involved in the crypto markets, understanding Bitcoin’s interaction with the 200 DMA can inform investment decisions—whether you’re a day trader, swing trader, or a long-term hodler.
Here are a few strategies to consider:
- Watch for confirmations: Wait for Bitcoin to decisively break above or below the 200 DMA with strong volume before making major moves.
- Diversify holdings: Given Bitcoin’s volatility around this level, diversification within crypto and other asset classes can reduce risk.
- Keep an eye on news: Regulatory or macroeconomic updates can quickly shift the market, affecting Bitcoin’s position relative to the 200 DMA.
Conclusion: Is the 200 Daily Average Within Reach?
Bitcoin’s journey toward or beyond its 200-day moving average is a key narrative shaping current market discussions. While short-term price action remains volatile, the long-term trend suggested by the 200 DMA remains a crucial benchmark.
Whether Bitcoin will hit or sustain above the 200 DMA soon depends on an interplay of technical factors, market sentiment, and external events influencing crypto markets worldwide. For investors and enthusiasts, keeping a close watch on this metric alongside broader market signals will provide valuable insights into Bitcoin’s next moves.
Stay informed, trade smart, and always consider the bigger picture when navigating the exciting world of crypto.